
VOD Analytics (V4): Track Views, Top Content & Engagement
The VOD Analytics (V4) dashboard gives studios clear visibility into how their on-demand content is performing. You can quickly see what’s being watched, who’s being watched, and how engagement changes over time, all in one place.
This feature is available to all VOD customers and updates automatically as viewers watch content.
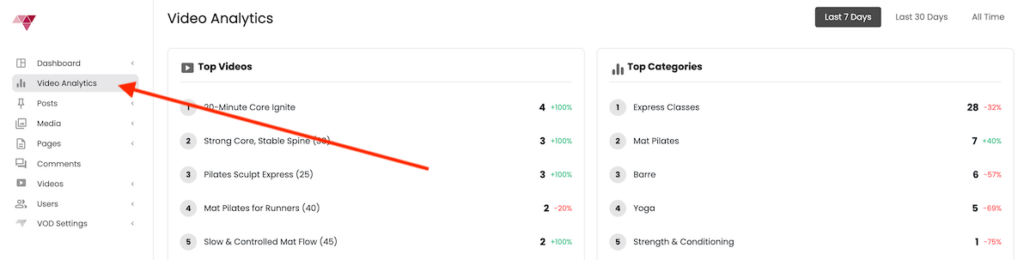
How to Track
Login to your Video On Demand admin experience and click the Analytics tab in your dashboard
What You Can Track
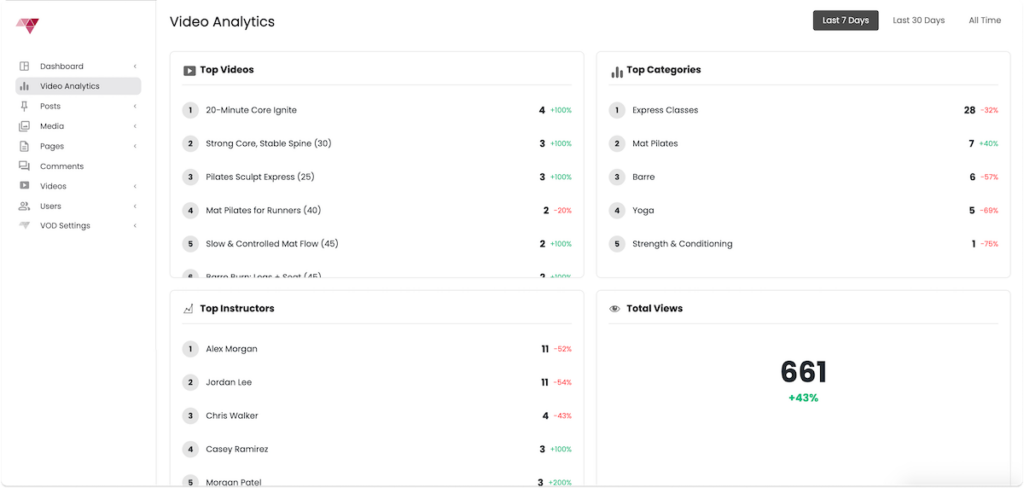
Total Views
See the total number of video views within a selected time period, with trend indicators showing performance compared to the previous period.
Use case: Quickly gauge overall engagement growth or dips week-over-week or month-over-month.
Top Videos
View your most-watched individual videos, ranked by total views.
Use case:
- Identify high-performing classes
- Decide which formats or class lengths resonate most
- Highlight popular content in marketing or featured sections
Top Categories
See which content categories (e.g. Vinyasa, Sculpt, HIIT, Restore) are driving the most engagement.
Use case:
- Optimize your content mix
- Spot trends in member preferences
- Guide future filming and programming decisions
Top Instructors
Track instructor performance based on total video views.
Use case:
- Understand which instructors drive the most on-demand engagement
Filters & Time Controls
The analytics dashboard includes flexible filters so you can drill down into the data that matters most.
Time Period
Select from predefined ranges such as:
- Last 7 Days
- Last 30 Days
- All Time
Use case: Compare short-term performance vs long-term trends.
Category Filter
Filter analytics by a specific content category to see how individual formats are performing.
Use case: Analyze demand for specific modalities like Sculpt vs Flow.
Instructor Filter
View analytics for a single instructor or compare performance across instructors.
Use case: Evaluate instructor-specific engagement or test new instructor launches.
Detailed Video View Table
Below the summary cards, you’ll find a detailed table showing:
- Video title
- Category
- Instructor
- Total views
This makes it easy to identify recent activity and confirm which videos are actively being watched.
Availability
- Included for all VOD customers
- No setup required
- Updates automatically as views occur
Note: Analytics are available by default.
Need Help or Have Questions?
If you have questions about VOD Analytics or want help interpreting your data, reach out to: support@ipstudio.co